10 KPIs Every Paid Marketing Dashboard Needs
Paid marketing is a cornerstone of digital strategy, but its true power lies in the ability to measure, analyse, and optimise performance in real time. A robust dashboard built around the right KPIs is essential for maximising return on ad spend, controlling costs, and demonstrating value. But with countless metrics available, which KPIs truly matter? Here are our top ten:
1. Cost Per Click (CPC)
CPC measures the average amount you pay each time someone clicks on your ad. It’s a crucial indicator of how efficiently your budget is being used and helps you monitor changes in competition and keyword pricing over time. Tracking CPC allows you to adjust bids and targeting to maintain cost-effectiveness, especially as market dynamics shift. The formula for calculating CPC is straightforward:
CPC = Total Cost of Advertisement ÷ Total Number of Clicks
For example, if you spend £1,000 on an ad campaign that generates 500 clicks, your average CPC would be £2.
Several factors determine how much you pay per click:
- Quality Score: Ads with higher quality scores tend to have lower CPCs.
- Ad Rank: Higher-ranking ads often come with increased costs.
- Competition: More advertisers bidding on the same keywords drive up prices.
- Relevance: Ads that better match user intent usually perform better, influencing CPC.
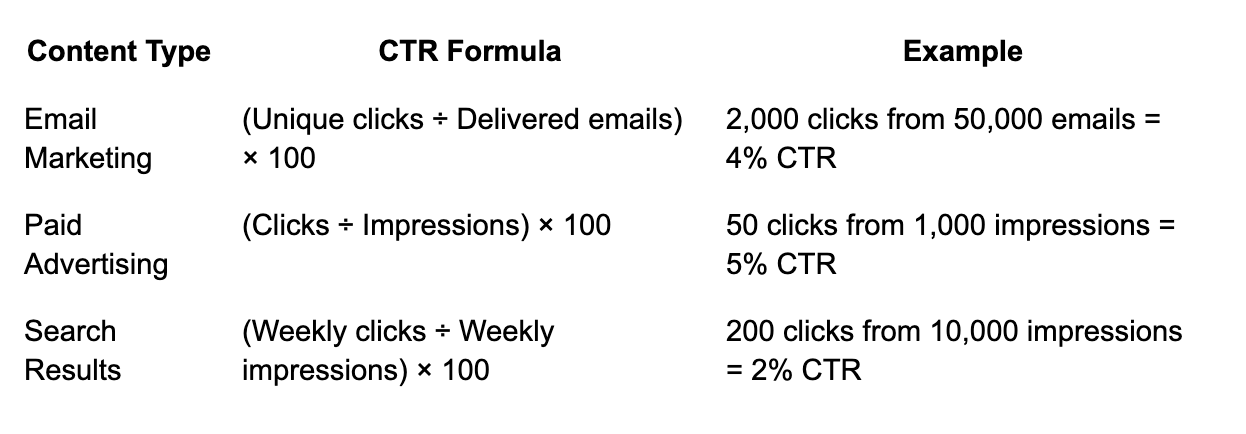
2. Click-Through Rate (CTR)
CTR is the percentage of people who click your ad after seeing it. This metric reveals how compelling your ad creative and messaging are to your target audience. High CTRs indicate strong relevance and engagement, while low CTRs suggest the need for creative or targeting adjustments. The formula for CTR is straightforward:
3. Conversion Rate
Conversion rate tracks the percentage of clicks that result in a desired action, such as a purchase or lead submission. It directly measures the effectiveness of your landing pages and ad targeting. Monitoring conversion rates helps you identify bottlenecks in the funnel and optimise for higher returns.
4. Cost Per Acquisition (CPA)
CPA, sometimes referred to as cost per conversion, tells you how much you’re spending to acquire each customer or lead. It’s calculated by dividing total ad spend by the number of acquisitions. Keeping CPA low is essential for profitability and helps you assess the true efficiency of your paid campaigns.
5. Return on Ad Spend (ROAS)
ROAS measures the revenue generated for every dollar spent on advertising. It’s a fundamental KPI for understanding campaign profitability and justifying ad budgets. A ROAS above 1 means your campaign is profitable, while a value below 1 signals losses and the need for immediate optimization. The formula to calculate ROAS is simple:
ROAS = Revenue ÷ Advertising Spend
For example, if you spend £1,000 on ads and earn £4,000 in revenue, your ROAS is 4:1 (or 4.0). This means you make £4 for every £1 spent.
ROAS benchmarks vary by industry, but here’s a general guide:

6. Impressions
Impressions count how many times your ad is shown to users. This metric is vital for assessing brand visibility and campaign reach, especially for awareness campaigns. Monitoring impressions helps you understand the scale of your paid efforts and informs budget allocation decisions.
7. Reach
Reach is the number of unique users who have seen your ad. Unlike impressions, which can count multiple views from the same user, reach focuses on audience size. Tracking reach ensures your campaigns are expanding your brand’s footprint and not just repeatedly targeting the same users.
8. Frequency
Frequency measures how often the average user sees your ad. While some repetition can reinforce messaging, high frequency can lead to ad fatigue and wasted spend. Monitoring this KPI helps you balance exposure and avoid diminishing returns.
9. Impression Share
Impression share is the percentage of total available impressions your ads capture in the marketplace. It provides insight into your visibility relative to competitors and can highlight budget or quality score limitations. A low impression share may indicate missed opportunities or the need for higher bids or improved ad quality.
10. Customer Lifetime Value (LTV)
LTV estimates the total revenue a customer will generate throughout their relationship with your brand. When paired with CPA, LTV helps you determine if your acquisition costs are sustainable and if you’re targeting the right audiences for long-term growth.
Best Practices for Paid Marketing Dashboard Implementation
When building a paid marketing dashboard, it’s vital to go beyond surface-level metrics and develop a tool that supports agile, data-driven decisions. Start by customising your dashboard to reflect the client’s unique goals—whether that’s lead generation, ecommerce sales, or brand awareness. Each campaign may require a different mix of KPIs, so tailor your reporting accordingly.
Automate data collection by integrating your dashboard with ad platforms like Google Ads, Meta Ads Manager, or LinkedIn Campaign Manager. This ensures real-time accuracy, reduces manual errors, and frees your team to focus on strategy and optimisation.
Effective visualisation is key. Use clear charts, graphs, and color-coding to make trends and anomalies instantly recognisable. This helps both technical and non-technical stakeholders quickly grasp performance and take action.
Segment your data by channel, campaign, audience, or geography to uncover granular insights. For example, comparing CPA or ROAS across different ad sets can reveal where to allocate more budget or which creatives are underperforming.
Finally, review and refine your dashboard regularly. Paid marketing is dynamic—new platforms, formats, and audience behaviors emerge constantly. Schedule periodic reviews to ensure your KPIs remain relevant and your dashboard evolves alongside your strategy.
Listen to the podcast version of our article here:


23.png)